Monitoring Salt Events
In some cases the Salt event bus could publish significant amount of events with a high rate, what could make it hard to analyze. Getting the statistics based on the events published in the Salt event bus can help to identify possible weak points and perform Salt internals profiling.
1. Saline
Saline is a powerful tool designed to function as a Prometheus exporter, enabling the collection of metrics based on events from the Salt event bus. These metrics are derived from event data available on the Salt master, similar to what is accessible through the command:
mgrctl exec -ti -- salt-run state.event
Saline is distributed as a separate container image, server-saline, for use with Uyuni Server.
All related commands and operations should be executed on the Uyuni Server container host system.
In addition to its role as a Prometheus exporter, Saline also provides the saline-formula, which simplifies configuration of Prometheus and Grafana dashboards, enhancing monitoring and visualization capabilities.
2. Saline deployment
Deployment instructions depend on when the customer decides to enable Saline.
-
Saline can be deployed during the initial installation or an upgrade of the Uyuni server, by using command:
mgradm install podman --saline-replicas 1
-
If the Uyuni server is already installed, you can enable Saline support without running a full server upgrade with this command:
mgradm scale uyuni-saline --replicas 1
-
If you want to upgrade and add Saline with one single command, use:
mgradm upgrade podman && mgradm scale uyuni-saline --replicas 1
In all scenarios, the only possible values for --saline-replicas are 1 or 0.
After finishing the deployment Uyuni-saline.service should be configured on the Uyuni Server host system.
3. Salt master configuration recommendations
It is recommended to add master_stats: True and adjust the value of master_stats_event_iter: 60 if needed.
Then restart salt-master to get the detailed statistics of internal Salt calls.
This can be help with tuning large scale deployment installations.
4. Saline formula
To configure Prometheus and Grafana dashboards, see Saline Formula.
5. Removing Saline
To remove Saline from the Uyuni Server use mgradm upgrade podman with --saline-replicas 0.
6. Examples of resulting Grafana dashboards
6.1. Uyuni Server (with Saline) dashboard
The dashboard represents Salt events with the different views presented on the panels.
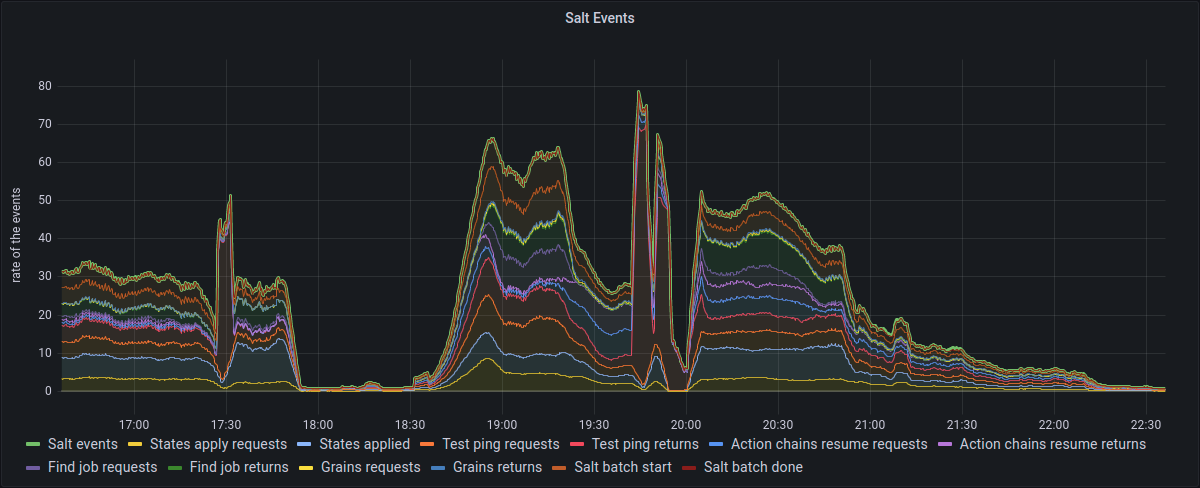
6.2. Salt Events
The panel represents all the Salt events grouped by categories. Salt events represents the total number of all categories of the events.

6.3. Minions Activity
The panel provides the minions activity status for the specified interval of times. It shows the amount of minions which were active in last minute, 5 minutes, 15 minutes, 1 hour or considered offline on this moment of time or even ever seen (could be targeted or either responded or not) or active.

6.4. Salt Events by Tags and Functions
The panel provides the detailed representation of Salt Events with the event spread by direction The events which are send to the minions are presented on the positive side of the axis, while the events received from the minions are presented on the negative side.

6.5. Salt States
The panel represents states apply process events grouped by the status: succeeded, failed, causing errors or applied in the test mode.

6.6. Salt Master Stats (runs)
The panel represents the number of internal calls grouped by function, which are exposed with Salt stats.

6.7. Salt Master Stats (avg. duration)
The panel represents the average duration of internal calls grouped by function, which are exposed with Salt stats.

7. Saline State Jobs dashboard
The dashboard represents Salt state apply process, it can be used for detailed monitoring of the internals of state apply process initiated for a number of targets.
7.1. Salt State Jobs (instant)
The panel represents an instant view of the state functions calls represented in the table view.

7.2. Salt States Profiling
The panel provides the table of state functions calls with the detailed profiling data that can be used for state optimization.
